🚀 Aralez performance benchmarks
💡 Simple benchmark by Oha
⚠️ These benchmarks use :
- 3 async Rust echo servers on a local network with 1Gbit as upstreams.
- A dedicated server for running Aralez
- A dedicated server for running Oha
- The following upstreams configuration.
- 9 test URLs from simple
/to nested up to 7 subpaths.
  myhost.mydomain.com:
    paths:
      "/":
        to_https: false
        headers:
          - "X-Proxy-From:Aralez"
        servers:
          - "192.168.211.211:8000"
          - "192.168.211.212:8000"
          - "192.168.211.213:8000"
      "/ping":
        to_https: false
        headers:
          - "X-Some-Thing:Yaaaaaaaaaaaaaaa"
          - "X-Proxy-From:Aralez"
        servers:
          - "192.168.211.211:8000"
          - "192.168.211.212:8000"
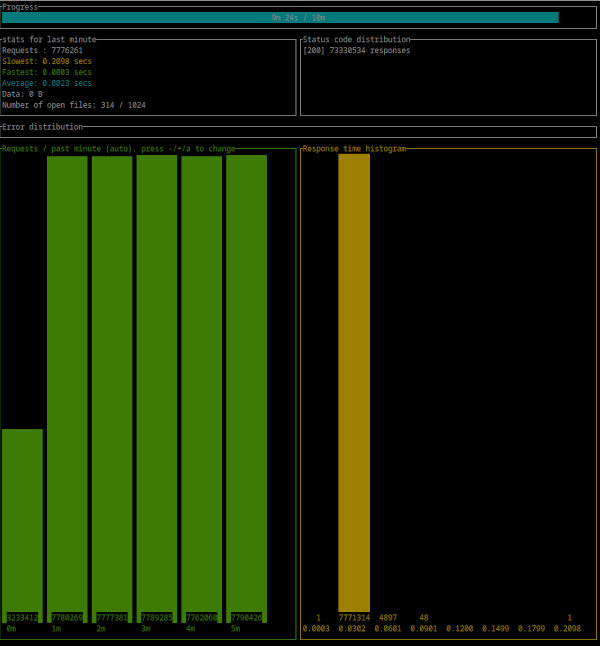
💡 Results reflect synthetic performance under optimal conditions.
- CPU : Intel(R) Xeon(R) CPU E3-1270 v6 @ 3.80GHz
- 300 : simultaneous connections
- Duration : 10 Minutes
- Binary : aralez-x86_64-glibc
Summary:
  Success rate: 100.00%
  Total:    600.0027 secs
  Slowest:  0.2138 secs
  Fastest:  0.0002 secs
  Average:  0.0023 secs
  Requests/sec: 129777.3838

  Total data:   0 B
  Size/request: 0 B
  Size/sec: 0 B

Response time histogram:
  0.000 [1]        |
  0.022 [77668026] |■■■■■■■■■■■■■■■■■■■■■■■■■■■■■■■■
  0.043 [190362]   |
  0.064 [7908]     |
  0.086 [319]      |
  0.107 [4]        |
  0.128 [0]        |
  0.150 [0]        |
  0.171 [0]        |
  0.192 [0]        |
  0.214 [4]        |

Response time distribution:
  10.00% in 0.0012 secs
  25.00% in 0.0016 secs
  50.00% in 0.0020 secs
  75.00% in 0.0026 secs
  90.00% in 0.0033 secs
  95.00% in 0.0040 secs
  99.00% in 0.0078 secs
  99.90% in 0.0278 secs
  99.99% in 0.0434 secs


Details (average, fastest, slowest):
  DNS+dialup:   0.0161 secs, 0.0002 secs, 0.0316 secs
  DNS-lookup:   0.0000 secs, 0.0000 secs, 0.0000 secs

Status code distribution:
  [200] 77866624 responses

Error distribution:
  [158] aborted due to deadline
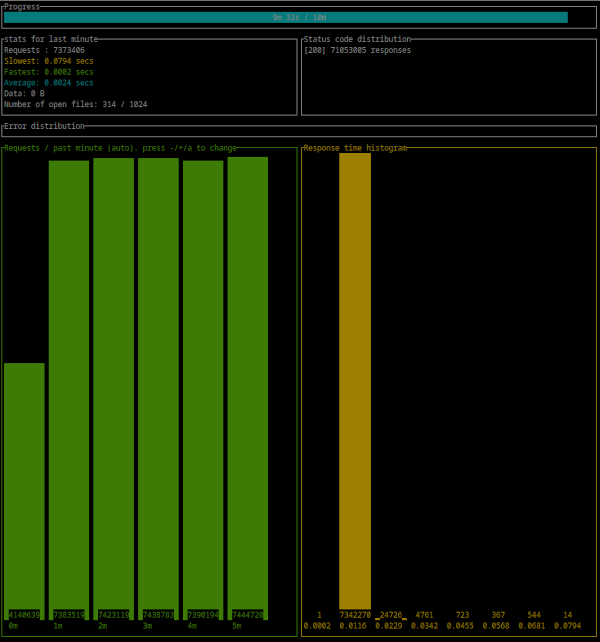
- CPU : Intel(R) Xeon(R) CPU E3-1270 v6 @ 3.80GHz
- 300 : simultaneous connections
- Duration : 10 Minutes
- Binary : aralez-x86_64-musl
Summary:
  Success rate: 100.00%
  Total:    600.0021 secs
  Slowest:  0.2182 secs
  Fastest:  0.0002 secs
  Average:  0.0024 secs
  Requests/sec: 123870.5820

  Total data:   0 B
  Size/request: 0 B
  Size/sec: 0 B

Response time histogram:
  0.000 [1]        |
  0.022 [74254679] |■■■■■■■■■■■■■■■■■■■■■■■■■■■■■■■■
  0.044 [61400]    |
  0.066 [5911]     |
  0.087 [385]      |
  0.109 [0]        |
  0.131 [0]        |
  0.153 [0]        |
  0.175 [0]        |
  0.196 [0]        |
  0.218 [1]        |

Response time distribution:
  10.00% in 0.0012 secs
  25.00% in 0.0016 secs
  50.00% in 0.0021 secs
  75.00% in 0.0028 secs
  90.00% in 0.0037 secs
  95.00% in 0.0045 secs
  99.00% in 0.0077 secs
  99.90% in 0.0214 secs
  99.99% in 0.0424 secs


Details (average, fastest, slowest):
  DNS+dialup:   0.0066 secs, 0.0002 secs, 0.0210 secs
  DNS-lookup:   0.0000 secs, 0.0000 secs, 0.0000 secs

Status code distribution:
  [200] 74322377 responses

Error distribution:
  [228] aborted due to deadline
🚀 Aralez, Nginx, Traefik performance benchmark
This benchmark is done on 4 servers. With CPU Intel(R) Xeon(R) E-2174G CPU @ 3.80GHz, 64 GB RAM.
- Sever runs Aralez, Traefik, Nginx on different ports. Tuned as much as I could .
- 3x Upstreams servers, running Nginx. Replying with dummy json hardcoded in config file for max performance.
All servers are connected to the same switch with 1GB port in datacenter , not a home lab. The results:
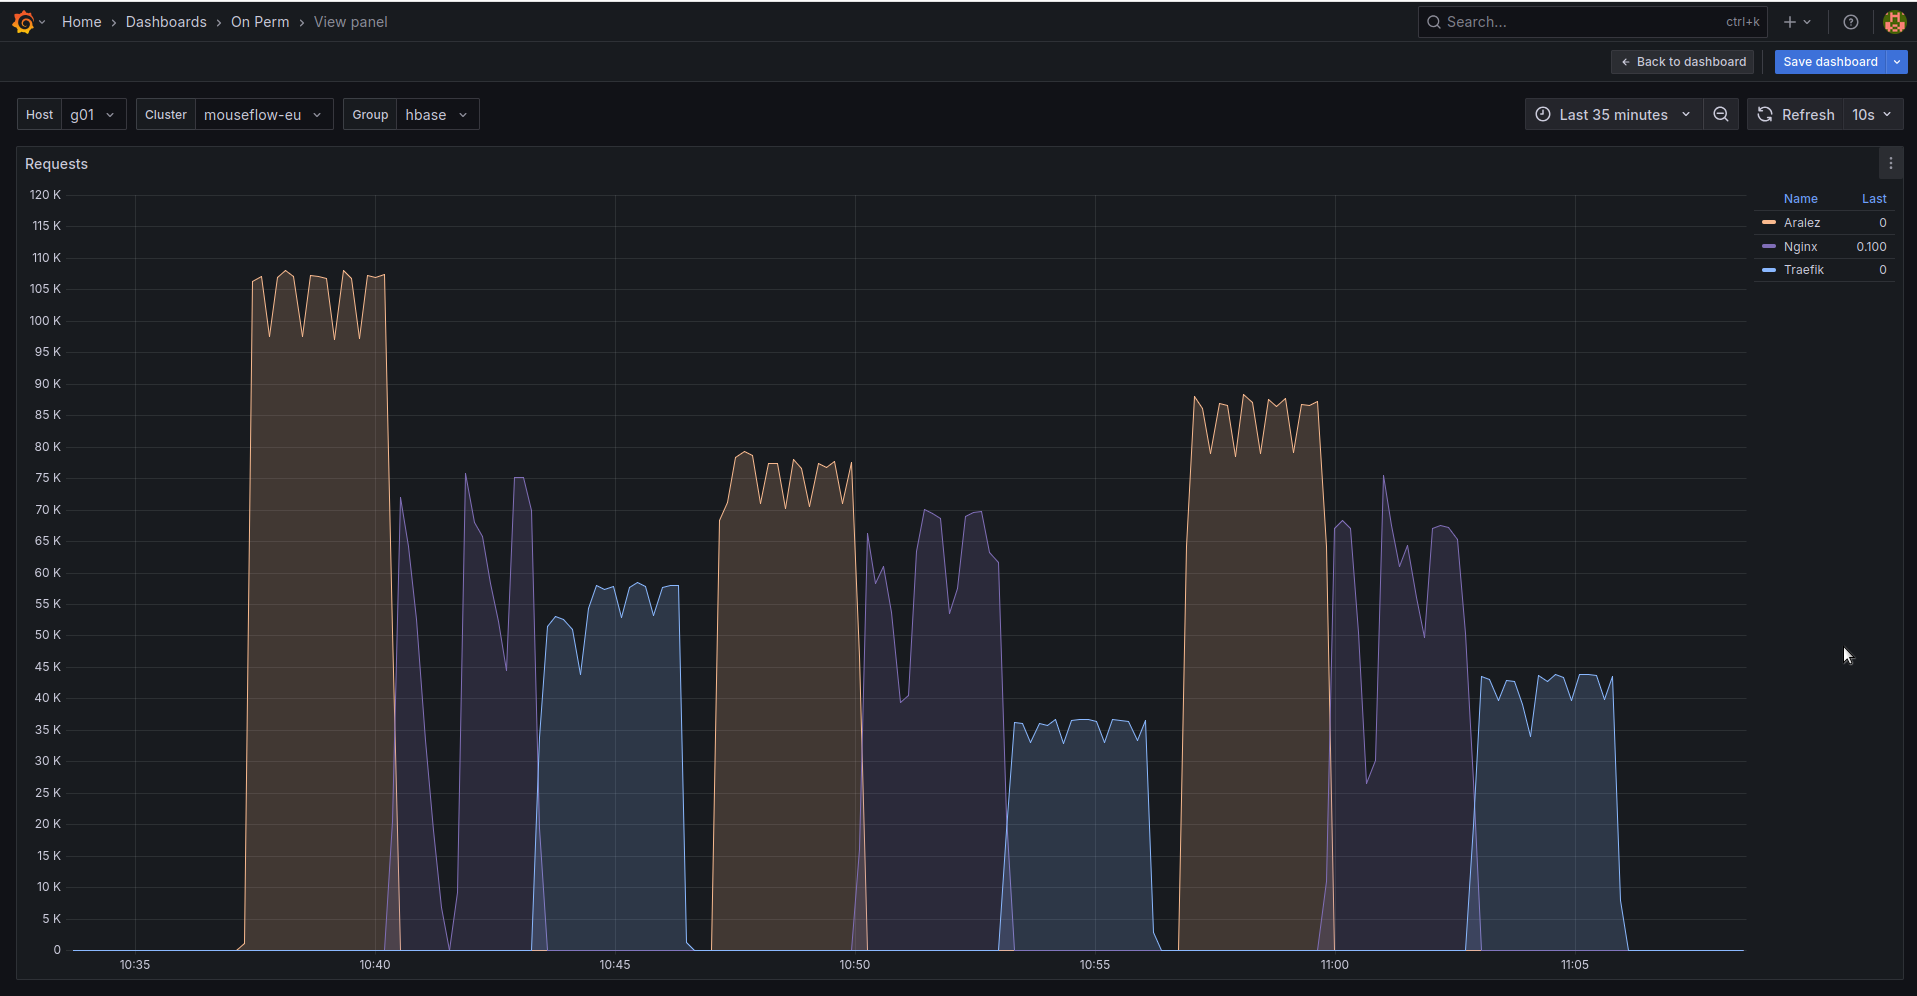
The results show requests per second performed by Load balancer. You can see 3 batches with 800 concurrent users.
- Requests via http1.1 to plain text endpoint.
- Requests to via http2 to SSL endpoint.
- Mixed workload with plain http1.1 and htt2 SSL.